The Oxrop data analysis software package
OxRop is a data analysis
package that was initially designed for the requirements of the
CRESST II dark matter experiment. It has since
expanded beyond its original purpose, and can now read not only CRESST
but EDELWEISS experimental
data, as well as the data formats used in
Technische Universität
München in Garching,
Institut de Physique
Nucléaire in Lyon, and squid magnetometry data from the
CryoEDM experiment. OxRop is an objected orientated program built in
C++ using the ROOT framework. This
gives access to the ROOT interpreter and graphical capabilities
providing flexibility for interactive, bespoke analyses.
OxRop contains all the tools necessary to move from
raw experimental data from a generic, multi-detector dark matter
experiment to a final yield plot, including pulse fitting and parameter
determination, energy calibration, cuts, frequency analysis,
mathematical parameter operations as well as general histogram and graph
functionality.
The future for OxRop is to become the data analysis
package for the future EURECA experiment.
Features
Oxrop takes input data is the form of events, which can be a
collection of signal pulses recorded by a CRESST detector, scintillation
events from a photomultiplier tube, or a magnetic field measurement over
a fixed time period. The program then calculates a large number of
parameter, such as pulse height, rise time, average value, for all
events. The following options are then available to display and analyse
the data:
- Event display: View single or multiple events.
- Histograms: Plot 1D or 2D histograms or any combination of
parameters.
- Cuts: Select events meeting specific criteria
- Mathematical operations: To calculate new parameters from
existing ones.
- Standard pulses: An accurate calculation of the pulse height is
done by creating a template pulse by summing a large number of
pulses produced by a calibration source.
- CPE: Converting pulse height to energy is a procedure to
determine the energy of events recorded by CRESST detectors, using
the signals produce by test pulses, generated by sending a
current pulse to the detector heater.
- FFT: Calculates the Fourier spectrum of event data.
- Parametric fit: Fits a given function to a data pulse, to
determine (for example) the rise and decay times of different
components.
- Advanced cut. A first step towards an automatic blind analysis,
the advantaged cut identifies contaminant events in CRESST data due
to detector noise, pile-up, SQUID resets, and other effects.
- Macros: As oxrop is fully integrated with the ROOT environment,
macros can easily be written to carry out analysis tasks.
Applications
- CRESST: oxrop was designed to analyse the data from the 33
phonon and light detectors for CRESST phase II.
- Scintillation studies: oxrop has been adapted to analyse
scintillation pulses recorded by photomultiplier tubes, as part
of the MPC analysis.
- Magnetometer: oxrop is used to analysis data from SQUID and
fluxgate magnetometers in the cryoEDM experiment.
- EDELWEISS: oxrop has been adapted to read data taken by the EDELWEISS
dark matter experiment. We anticipate it will be used as the
analysis program for EURECA.
Other software
Oxrop is part of an extended suite of software developed by
our group. Other programmes include:
- DaqClient: A data acquisition programme, designed to
interface with a wide range of hardware. DaqClient is used
to record magnetometry data for cryoEDM, as well as for
scintillation studies (with photomultipliers), and cryogenic
detector tests in Oxford.
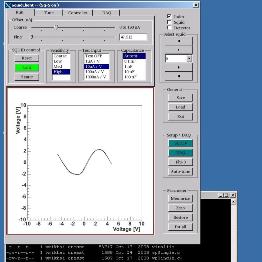
- SquidClient: An application written to tune and control
and 66 SQUID sensors for CRESST II. Also used for cryoEDM
and other SQUID tests.
|
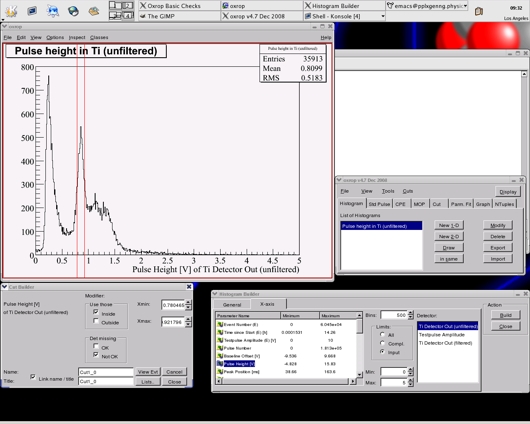 |
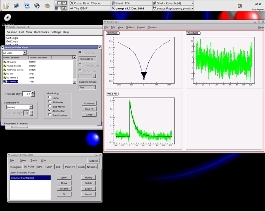
Oxrop screenshot showing the histogram builder and cut function
|
|
|
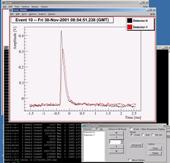
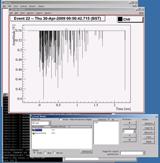
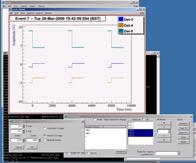
The event viewer, for three different types of event
|
|
|
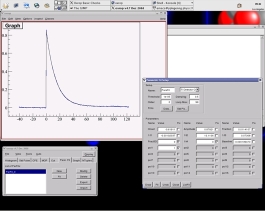
The standard pulse fitter, and parametric fit.
|
 |
 |
| DaqClient |
SquidClient |
|
|


